Chart Data
The Chart Data tab is a powerful feature in ChartGPT that allows you to analyze and interact with your chart data using advanced AI capabilities. This tab provides a comprehensive view of your chart data and enables you to leverage Large Language Models (LLMs) for in-depth analysis.
Key Features
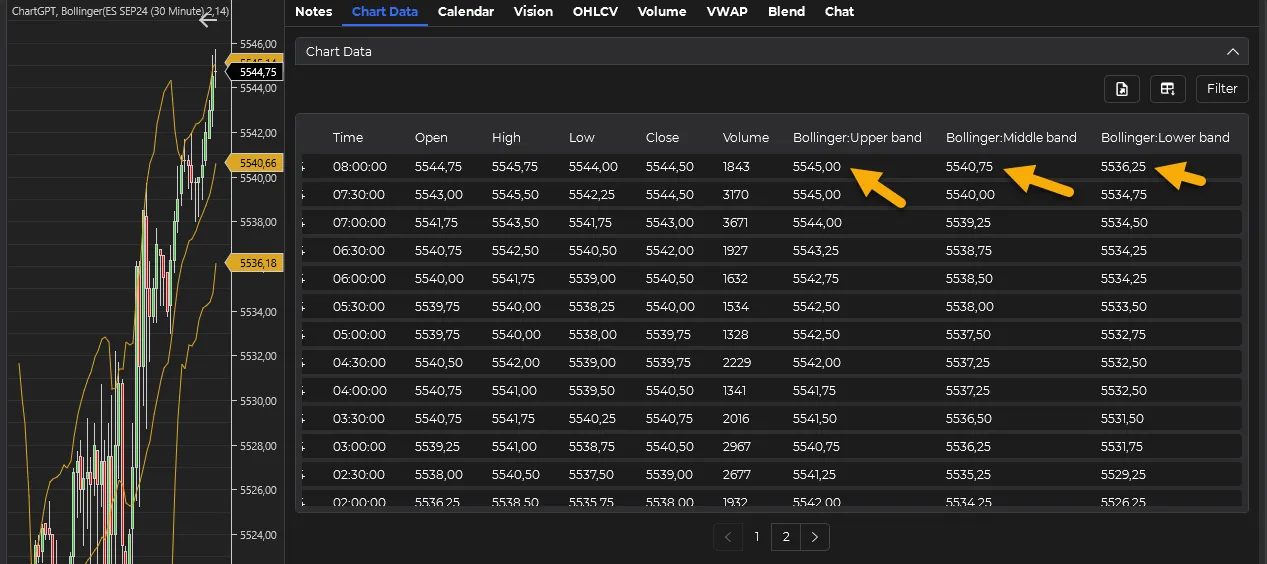
- Indicator Integration: Automatically displays indicators added to your chart (as long as they provide data that is exposed, normally trough plots).
- Column Customization: Organize and save preferred data column layouts.
- Pagination: Efficiently navigate large datasets.
- Data Filtering: Focus on specific time periods or data points.
- CSV Export: Export data for further analysis (Personal and Pro tiers).
- AI-Powered Analysis: Leverage LLMs for in-depth chart data analysis.
- Real-Time Updates: Configure indicators for frequent data updates.
- Ticksize Rounding: All values rounded to instrument’s ticksize for consistency.
Top Menu
![]()
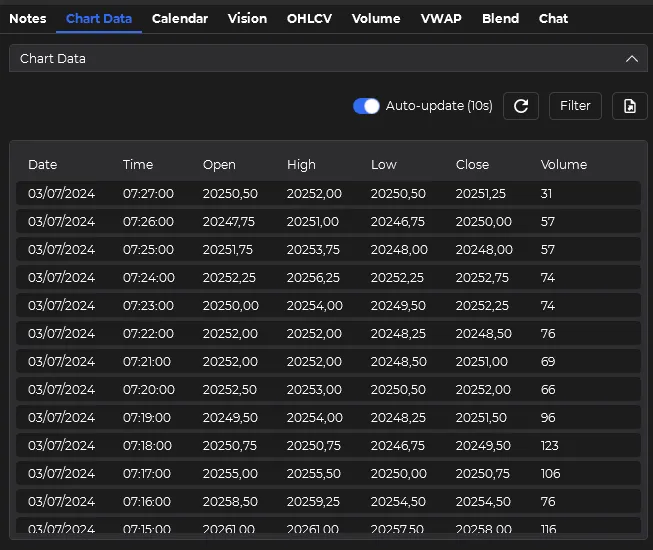
The top menu offers several key functions:
- Auto-Update Toggle: Enable or disable automatic refreshing of the data grid every 10 seconds.
- Manual Refresh: Update the data grid instantly by clicking the refresh button.
- Filter: Access the filtering options to focus on specific data. Learn more about filtering.
- Export CSV: Available for Pro tier subscribers, export the data grid to a CSV file. See features details.
Filter
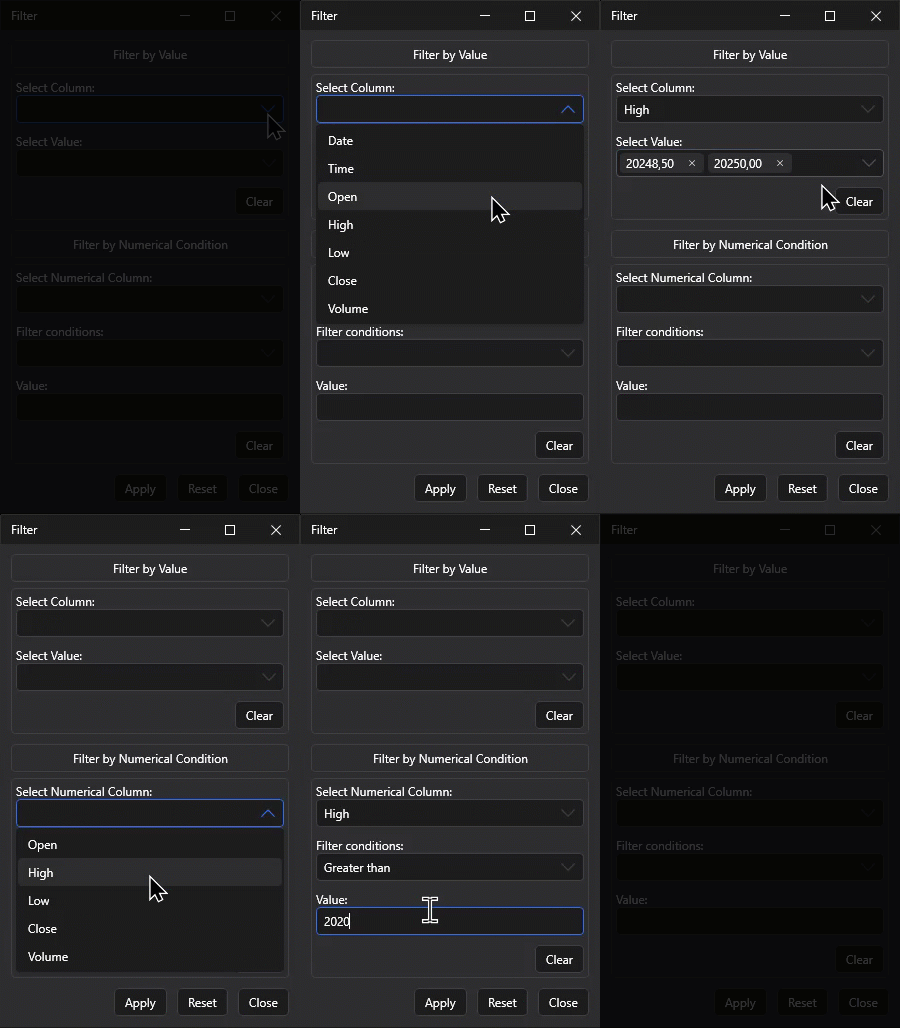
- Filtering: Apply filters to your data to focus on specific time periods or data points.
-
CSV Export: Export your data as a CSV file for further analysis.
Customizing Your Data View
Our app provides powerful customization options to help you tailor your trading experience. Here are two key features you should know about:
Selecting Columns to Display
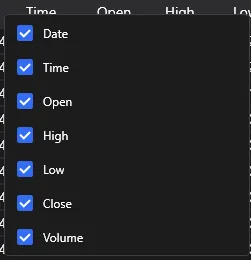
You can easily customize which columns are displayed in the data grid:
- Right-click on any of the column headers.
- A dropdown menu will appear, showing all available columns.
- Check or uncheck the boxes next to each column name to show or hide them.
- Your selection will be automatically saved for your next session.
This feature allows you to focus on the data that matters most to you, reducing clutter and improving your workflow.
Rearranging Columns
You can also change the order of columns to suit your preferences:
- Click and hold on the header of the column you want to move.
- Drag the column left or right to its new position.
- Release the mouse button to drop the column in its new location.
The new column order will be preserved for future sessions, allowing you to create a personalized layout that best supports your trading strategy.
These customization options are designed to give you full control over your data view, helping you make informed decisions quickly and efficiently.
Chart Indicators Last Bars display
To ensure that the Chart Data tab displays the most recent data, including the last bar, it’s crucial to configure your indicators correctly:
-
Go to the indicator’s properties
Navigate to the properties section of your chosen indicator.
-
Locate the “Calculate” option
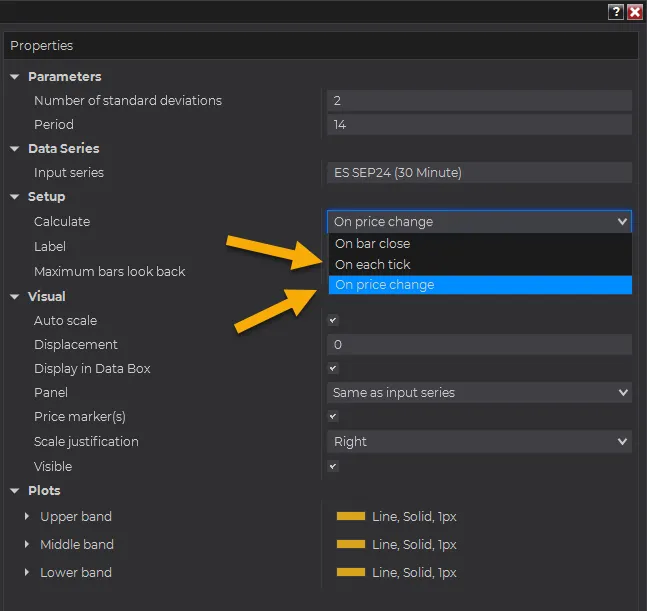
In the “Setup” section, find the “Calculate” option.
-
Set the update frequency
Set this option to either “On Price Change” or “On Each Tick”.
This configuration allows the data grid to update more frequently, providing you with the most current information.
Usage Tips
- Indicator Optimization: Add relevant indicators to your chart before analyzing to provide the AI with more context.
- Structured Prompts: Create clear, specific prompts for more accurate and useful AI responses.
- Regular Exports: Periodically export your data to keep a record of your analysis over time.
The Chart Data tab is designed to be a powerful tool for traders who want to leverage AI for deeper insights into their trading data. By combining traditional chart analysis with cutting-edge AI technology, ChartGPT provides a unique advantage in understanding market dynamics.