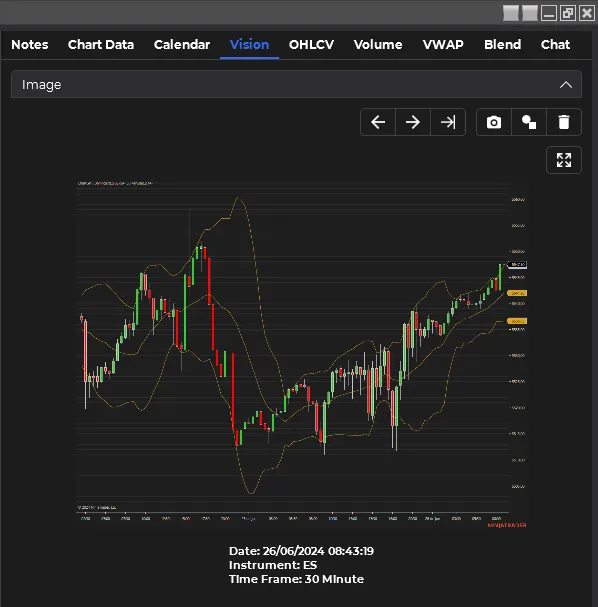
Vision Tab
The Vision tab is an advanced feature available in Personal and Pro editions, introducing multimodal analysis capabilities to your trading toolkit.

Key Features
Image Integration
- Capture and analyze screenshots of your chart
- Include drawing tools data for more comprehensive analysis (Pro edition only)
AI-Powered Image Analysis
- Submit chart images for AI interpretation
- Receive detailed insights based on visual patterns and indicators
Text-to-Speech Conversion
- Convert AI responses to audio
Using the Vision Tab
-
Capture Chart Image The system will automatically capture the visible area of your chart, including any zoom effects.
-
Review Captured Image The screenshot will appear in the image section of the Vision tab.
-
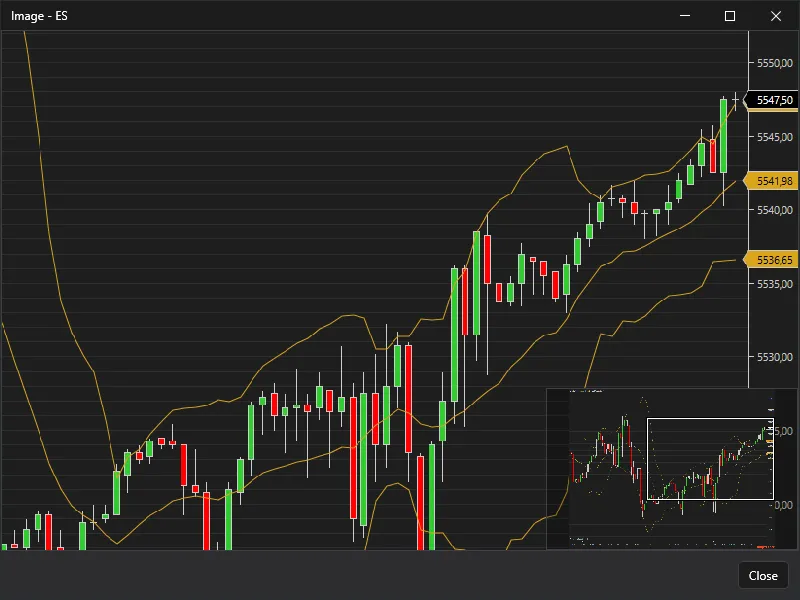
Maximize and Inspect Image

- Click on the maximize button to open the image in a separate window.
- Use the zoom controls in this window to examine specific areas of the chart in detail.
- Close the window when you’re done to return to the Vision tab.
-
Add Drawing Tools (Pro Edition) If you’re using the Pro edition, your drawing tools will be included in the data sent for analysis.
Navigation and Management
- Use navigation buttons to move between different images and analyses
- Delete unwanted images and their associated responses to keep your workspace organized
Best Practices
- Zoom Appropriately: Ensure the most relevant parts of your chart are visible before capturing the image.
- Include Context: When using drawing tools, make sure they add valuable context to your chart analysis.
- Craft Clear Prompts: Be specific in your prompts to get the most relevant insights from the AI.
- Compare Analyses: Use the navigation features to compare AI interpretations of different chart states or timeframes.
Integrating Vision Analysis with Other Tabs
The Vision tab’s multimodal capabilities complement other tabs in the application:
- Use insights from the Vision tab to inform your prompts in the Chart Data tab
- Compare AI interpretations of visual patterns with numerical data from the OHLCV or VWAP tabs
- Incorporate economic event information from the Calendar tab into your visual analysis prompts
By leveraging the Vision tab effectively, you can add a powerful visual dimension to your AI-assisted trading analysis, potentially uncovering patterns and insights that might be missed through numerical data alone.