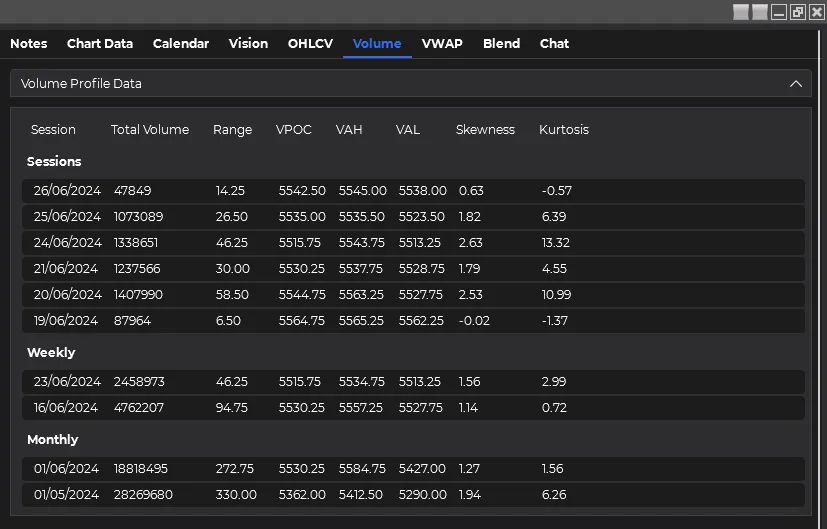
Volume Profile Tab
The Volume Profile tab provides traders with a powerful tool to analyze volume distribution across different price levels. This feature, combined with AI-powered analysis, offers unprecedented insights into market structure and potential trading opportunities.

Key Features
Multi-Timeframe Data Analysis
- Current Week: Detailed volume profile for the most recent trading activity
- Previous Two Weeks: Extended analysis to identify short-term trends
- Previous Two Months: Broader context for longer-term volume patterns
Data Resolution Options
- Minute Data: Default for weekly and monthly timeframes
- Tick Data: Available for more granular analysis (if selected in chart settings)
Comprehensive Volume Metrics
- Total Volume: Overall trading activity for each session
- Daily Range: High and low prices for each trading day
- Volume Profile Data:
- VPOC (Volume Point of Control): Price level with the highest trading volume
- VAH (Value Area High): Upper boundary of the value area
- VAL (Value Area Low): Lower boundary of the value area
Statistical Measures
- Additional metrics to provide deeper insights into the volume profile shape and characteristics
Using the Volume Profile Tab
-
Review Data Examine the volume profile data presented in a structured format across different timeframes.
-
Formulate Prompt Craft a specific prompt to analyze aspects of the volume profile data. For example: “Analyze the relationship between the VPOC and price movement over the past two weeks.”
-
Select AI Model Choose your preferred AI model for analysis from the dropdown menu.
-
Initiate Analysis Click the “Analyze Volume Profile” button to submit your prompt and data for AI processing.
-
Review AI Response Read the AI’s interpretation and analysis of the volume profile data in the response section.
-
Convert to Speech (Optional) Use the text-to-speech feature to listen to the AI’s response.
Best Practices
- Compare Timeframes: Utilize the multi-timeframe data to identify shifts in volume patterns over time.
- Focus on Key Levels: Pay special attention to the VPOC, VAH, and VAL when formulating your prompts.
- Combine with Price Action: Ask the AI to analyze how volume profile structures relate to recent price movements.
- Look for Anomalies: Request the AI to identify unusual volume patterns or divergences from typical structures.
- Consider Market Context: Incorporate knowledge of recent market events or news when interpreting the AI’s analysis.
Integrating Volume Profile Analysis with Other Tabs
The Volume Profile tab’s insights can be powerfully combined with other features in the application:
- Use Volume Profile insights to inform your chart analysis in the Vision tab
- Combine Volume Profile data with VWAP information for a more comprehensive view of price and volume interaction
- Cross-reference Volume Profile patterns with economic events from the Calendar tab to understand how market structure might be influenced by upcoming news
By effectively utilizing the Volume Profile tab and its AI-powered analysis, you can gain deep insights into market dynamics, potentially identifying key support and resistance levels, and understanding how volume is distributed across different price ranges. This information can be crucial for making informed trading decisions and developing robust trading strategies.